Stress-testing Core Data
Core Data is often dunked on for its performance, especially involving large quantities of objects. Let’s dig into this.
I don’t think I wrote many apps in the last 10 years that did not involve Core Data. Apps without Core Data:
- have just a handful of screens with no shared data between them
- are demonstration / help type of app, basically a glorified user manual
But if app has any kind of model graph / data shared across multiple views, I choose Core Data without hesitation. Its strengths are in handling of relationships, its transparently cached and batched data fetching, seamless notification on insert/update of entity properties. The list of functionality you get for free is impressive.
One aspect that Core Data is not known for is raw performance. Vast majority of apps don’t really need super high persistence performance, certainly not any of the apps I have worked on. But it’s something to keep in mind and I’m always checking few things on physical devices:
- CPU usage, especially time spent in code blocks which “lock” one CPU core
- memory consumption
CPU usage became less important since iPhones started shipping with at least 2-core CPUs (do you remember which iPhone that was?). But memory is always a challenge and worth optimizing for; it does not matter if all the Core Data work you do happens on background threads if the app consumes GBs of memory. This can lead to excessive memory fragmentation, background app termination etc.
Which is why recent performance tests published on Emerge Tools blog picked my interest. They compared Realm vs Swift Data, two persistence solutions I have no experience with, despite Swift Data being essentially the same as Core Data. Enter Helge Heß who updated the test suit with pure Core Data test suite.
The numbers he posted were frankly shocking, way beyond anything I have ever seen in my own Core Data usage. Granted — I never attempted to insert 100k or 1M objects in one commit but I understand this is performance stress test. Thus let’s forgo common sense for a bit and analyze the performance results, which I re-ran on iPhone 14 Pro:
===============
CoreData: 100 Simple Objects
===============
User instantiation: 0.0008
Create users: 0.0129
DB file size: 0.03 MB
Delete all users: 0.0003

===============
CoreData: 1.000 Simple Objects
===============
User instantiation: 0.0035
Create users: 0.0102
DB file size: 0.03 MB
Delete all users: 0.0009

===============
CoreData: 10.000 Simple Objects
===============
User instantiation: 0.0248
Create users: 0.0745
DB file size: 0.03 MB
Delete all users: 0.0059

===============
CoreData: 100.000 Simple Objects
===============
User instantiation: 0.2107
Create users: 0.8991
DB file size: 7.22 MB
Delete all users: 0.0867

===============
CoreData: 1.000.000 Simple Objects
===============
User instantiation: 2.2695
Create users: 39.7839
DB file size: 72.46 MB
Delete all users: 3.8762
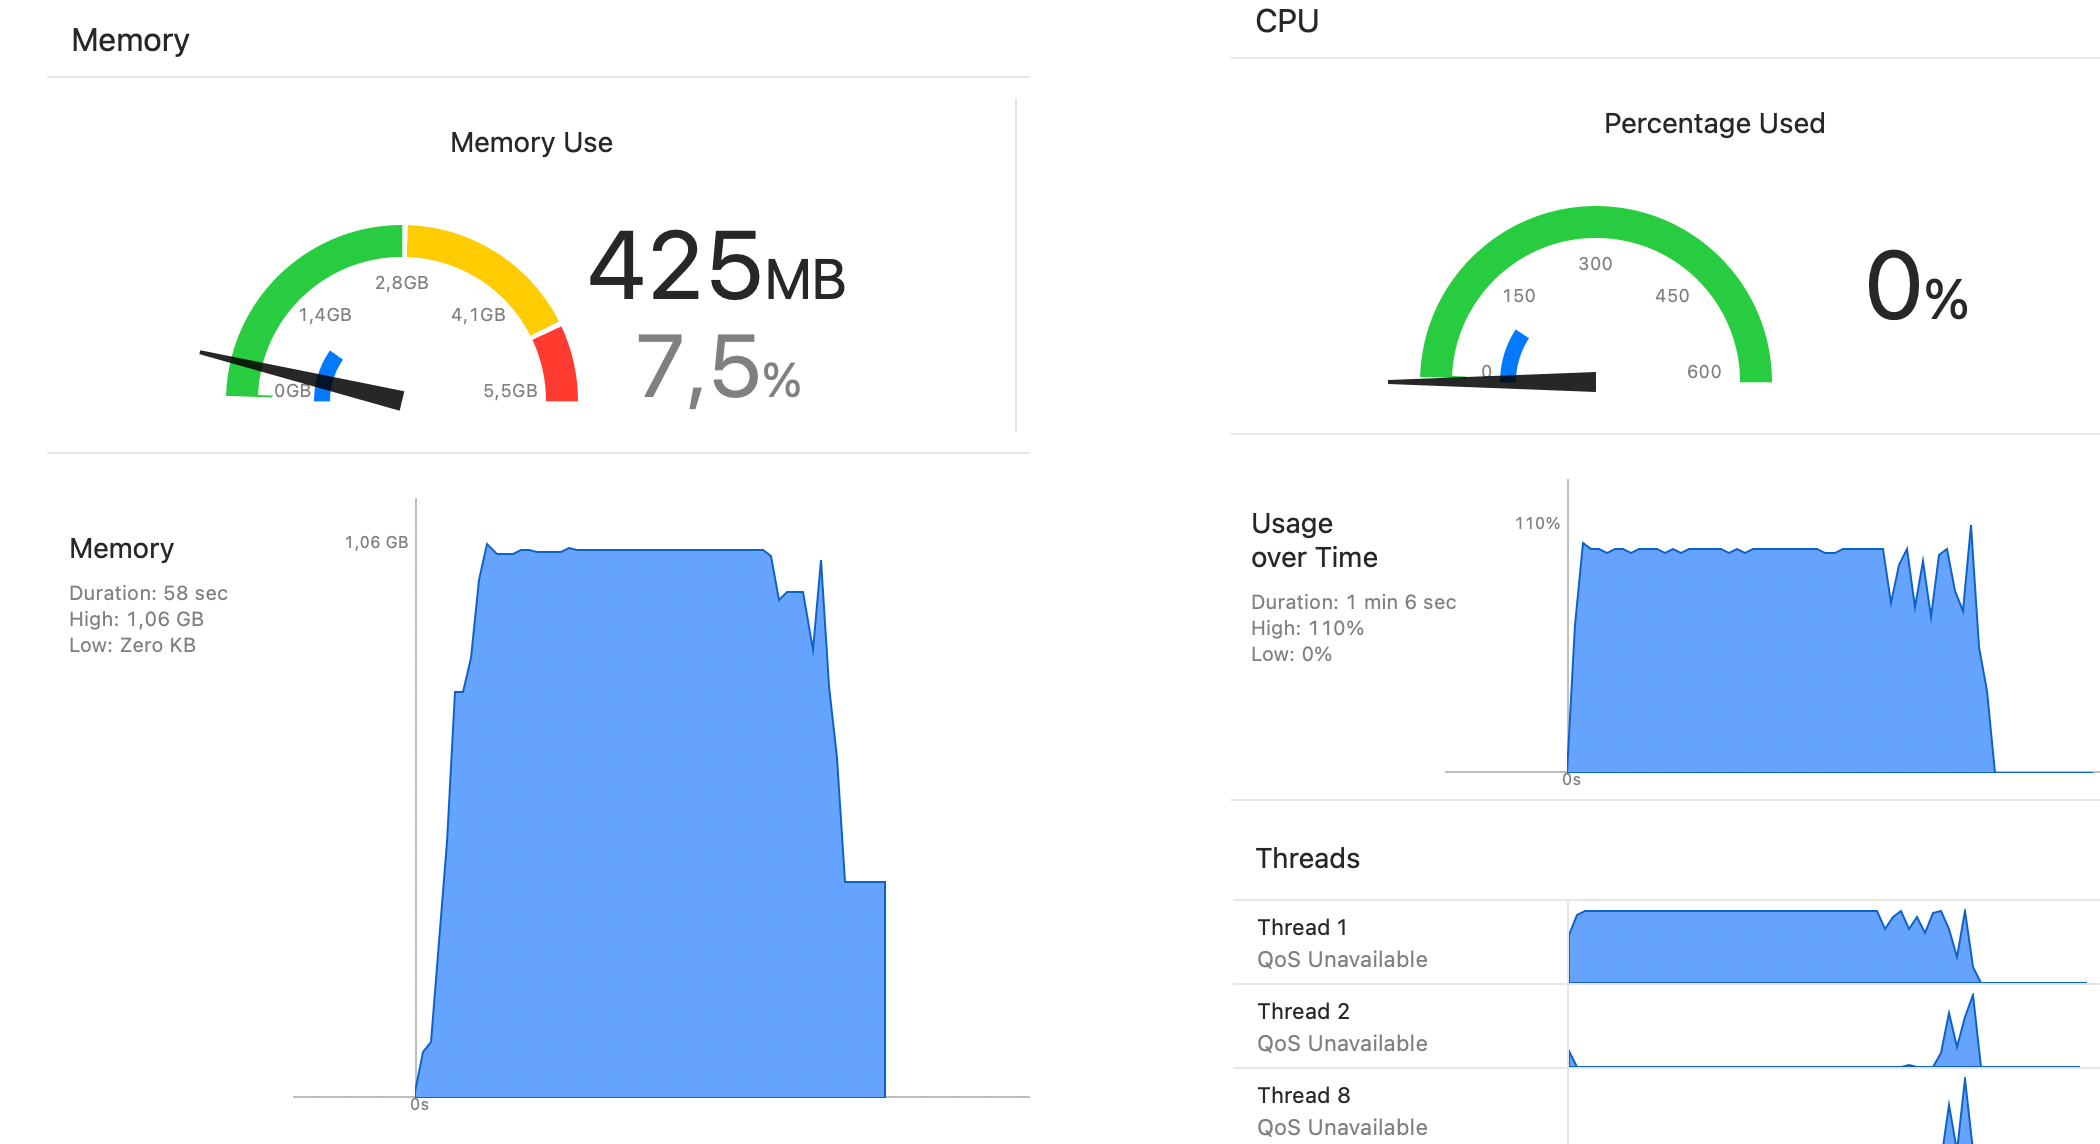
The problematic part is huge jump from 100k to 1M: 1s went to over 40 seconds. 40× more!
The memory graph is terrifying with over 1GB peak usage:
Looking at the test code, first thing I did was isolate each test. I see in the code that each tests begins with fresh database creation but I still wanted to completely isolate each test run. Thus I removed (commented) out all but Core Data tests:
func runAllPerformanceTests() {
    for num in [100, 1_000, 10_000, 100_000, 1_000_000] {
        coreUsersPerformanceTests(with: num)
    }

    deleteAllDatabaseFiles()
}
and also delete the app from device after each test. Results I posted above are after one such isolated run.
Let’s look at the test suite:
func coreUsersPerformanceTests(with usersCount: Int = 100_000) {
    let db = try! CoreUserDB()

    try! db.deleteAll()

    var users = [CoreUser]()
    logExecutionTime("User instantiation") {
        users = (0..<usersCount).compactMap { _ in CoreUser() }
    }

    logExecutionTime("Create users") {
        try! db.create(users)
    }

    logExecutionTime("Fetch users named `Jane` in age order") {
      ...
    }

    logExecutionTime("Rename users named `Jane` to `Wendy`") {
      ...
    }

    measureSize(of: db)

    logExecutionTime("Delete all users") {
        try! db.deleteAll()
    }
}
After creating the test database, test will
- create X User instances in memory
- Insert all instances to one
NSManagedObjectContextand then save that context - Execute one test fetch returning subset of objects
- Update one property (
name) then save it - Measure database size on disk
- Measure how long it takes to delete all previously created objects from database, using batch-delete API.
Main time sync, per logged times, is step 2. So let’s look at steps 1 and 2, since they are essentially one import operation:
var users = [CoreUser]()
users = (0..<usersCount).compactMap { _ in CoreUser() }

try! db.create(users)
or if we unpack the create(_) method:
var users = [CoreUser]()
users = (0..<usersCount).compactMap { _ in CoreUser() }

let context = ModelContext(container)
users.insertWithAllDependencies(into: context)
try context.save()
Let’s start optimizing this.
First thing I added is context.reset() after the save(). We don’t use all of these objects after creating them, we are actually doing a fetch for the next step so it makes no sense to keep all these objects in memory. This one line created a noticeable dip in the memory usage:
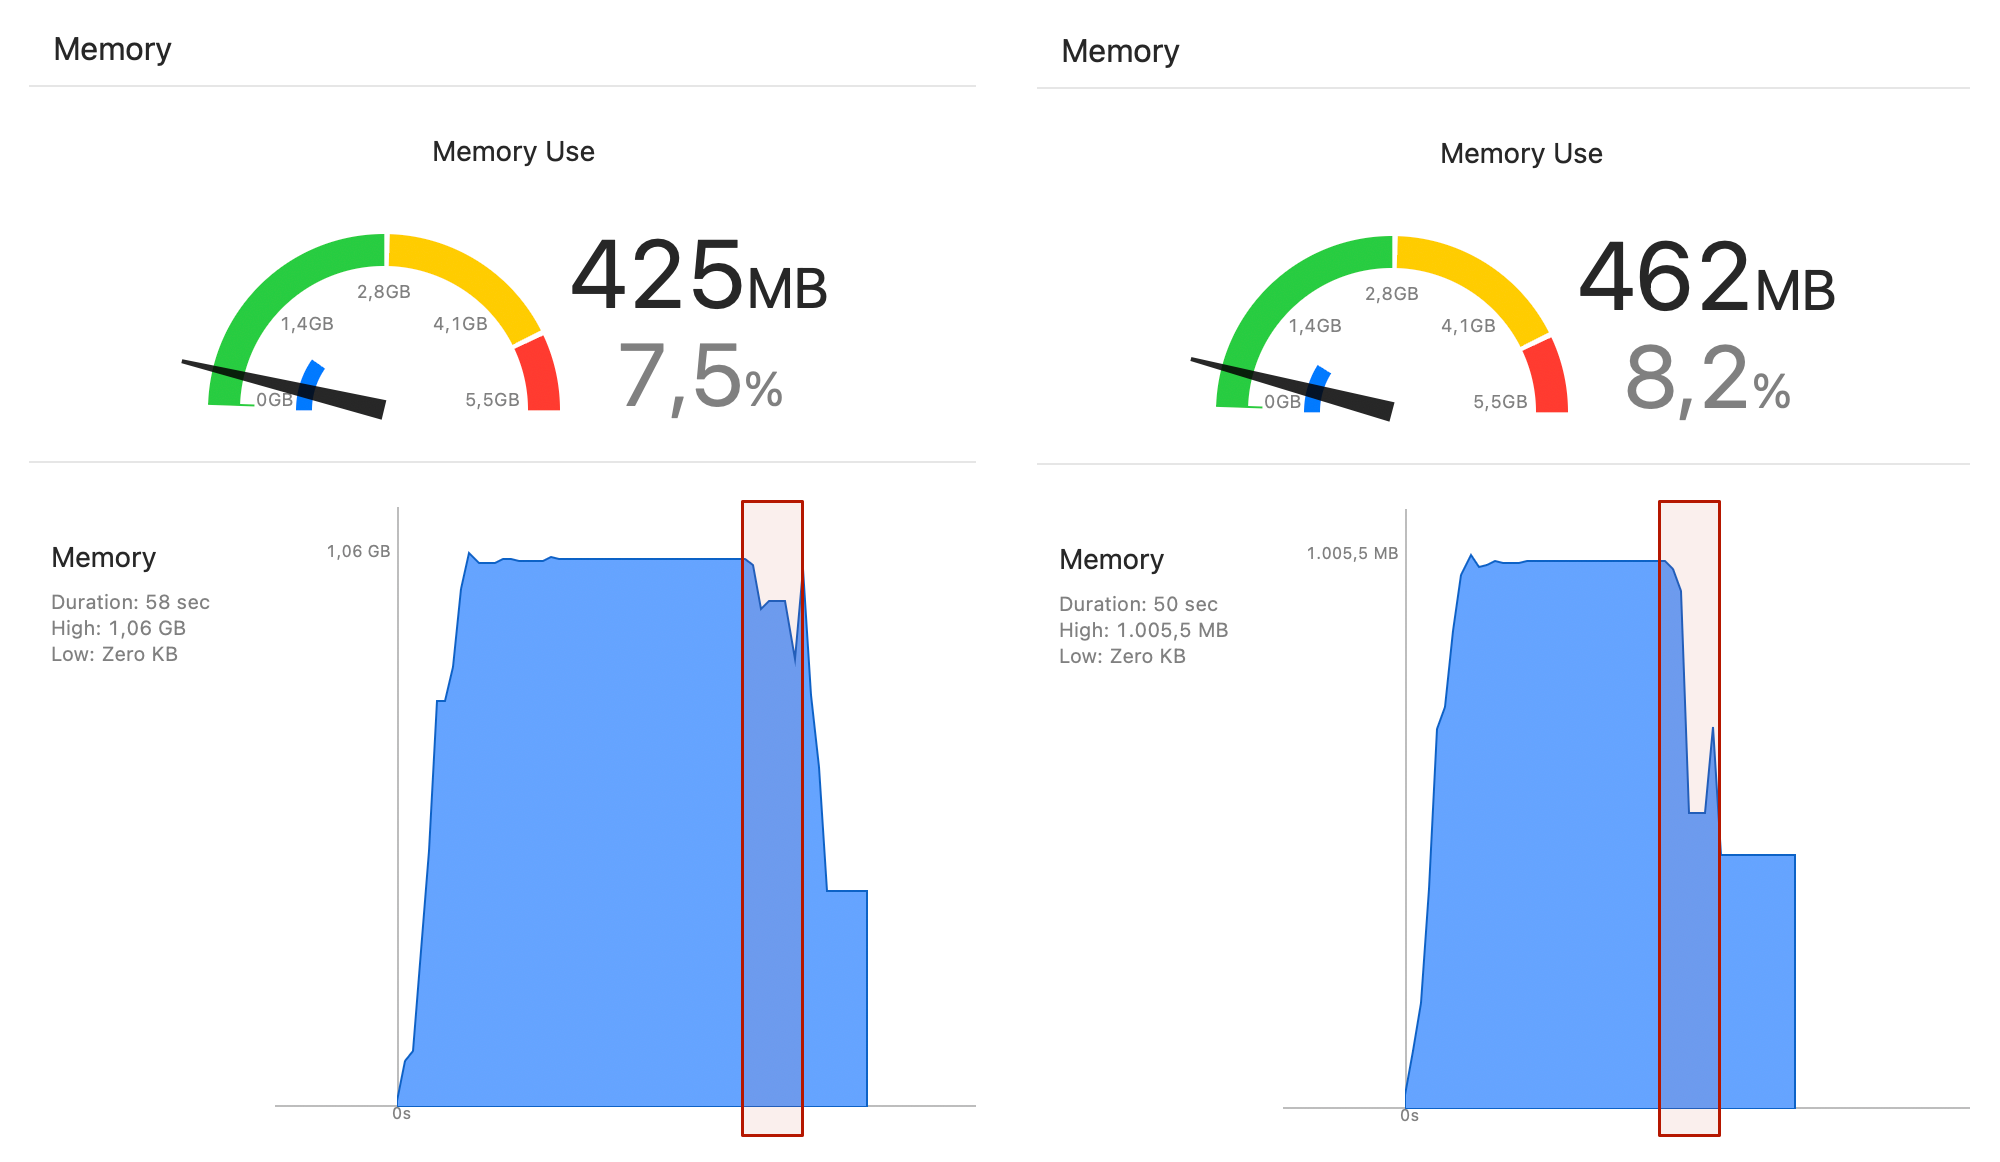
But main issue remains that we create 1 million records and save them all at once. Since we already know that 100k import is fast enough, let’s split this 1M into 10 commits with 100k records each:
let importer: (Int) -> Void = { limit in
	var users = [CoreUser]()
	logExecutionTime("User instantiation") {
		users = (0..<limit).compactMap { _ in CoreUser() }
	}

	logExecutionTime("Create users") {
		try! db.create(users)
	}
}

let chunk = 100_000
if usersCount <= chunk {
	importer(usersCount)

} else {
	logExecutionTime("Total \( usersCount ) User instantiation + Create") {
		let limit = usersCount / chunk
		for i in (0 ..< limit) {
			print("Chunk count: \( i )")
			importer(chunk)
		}
	}
}
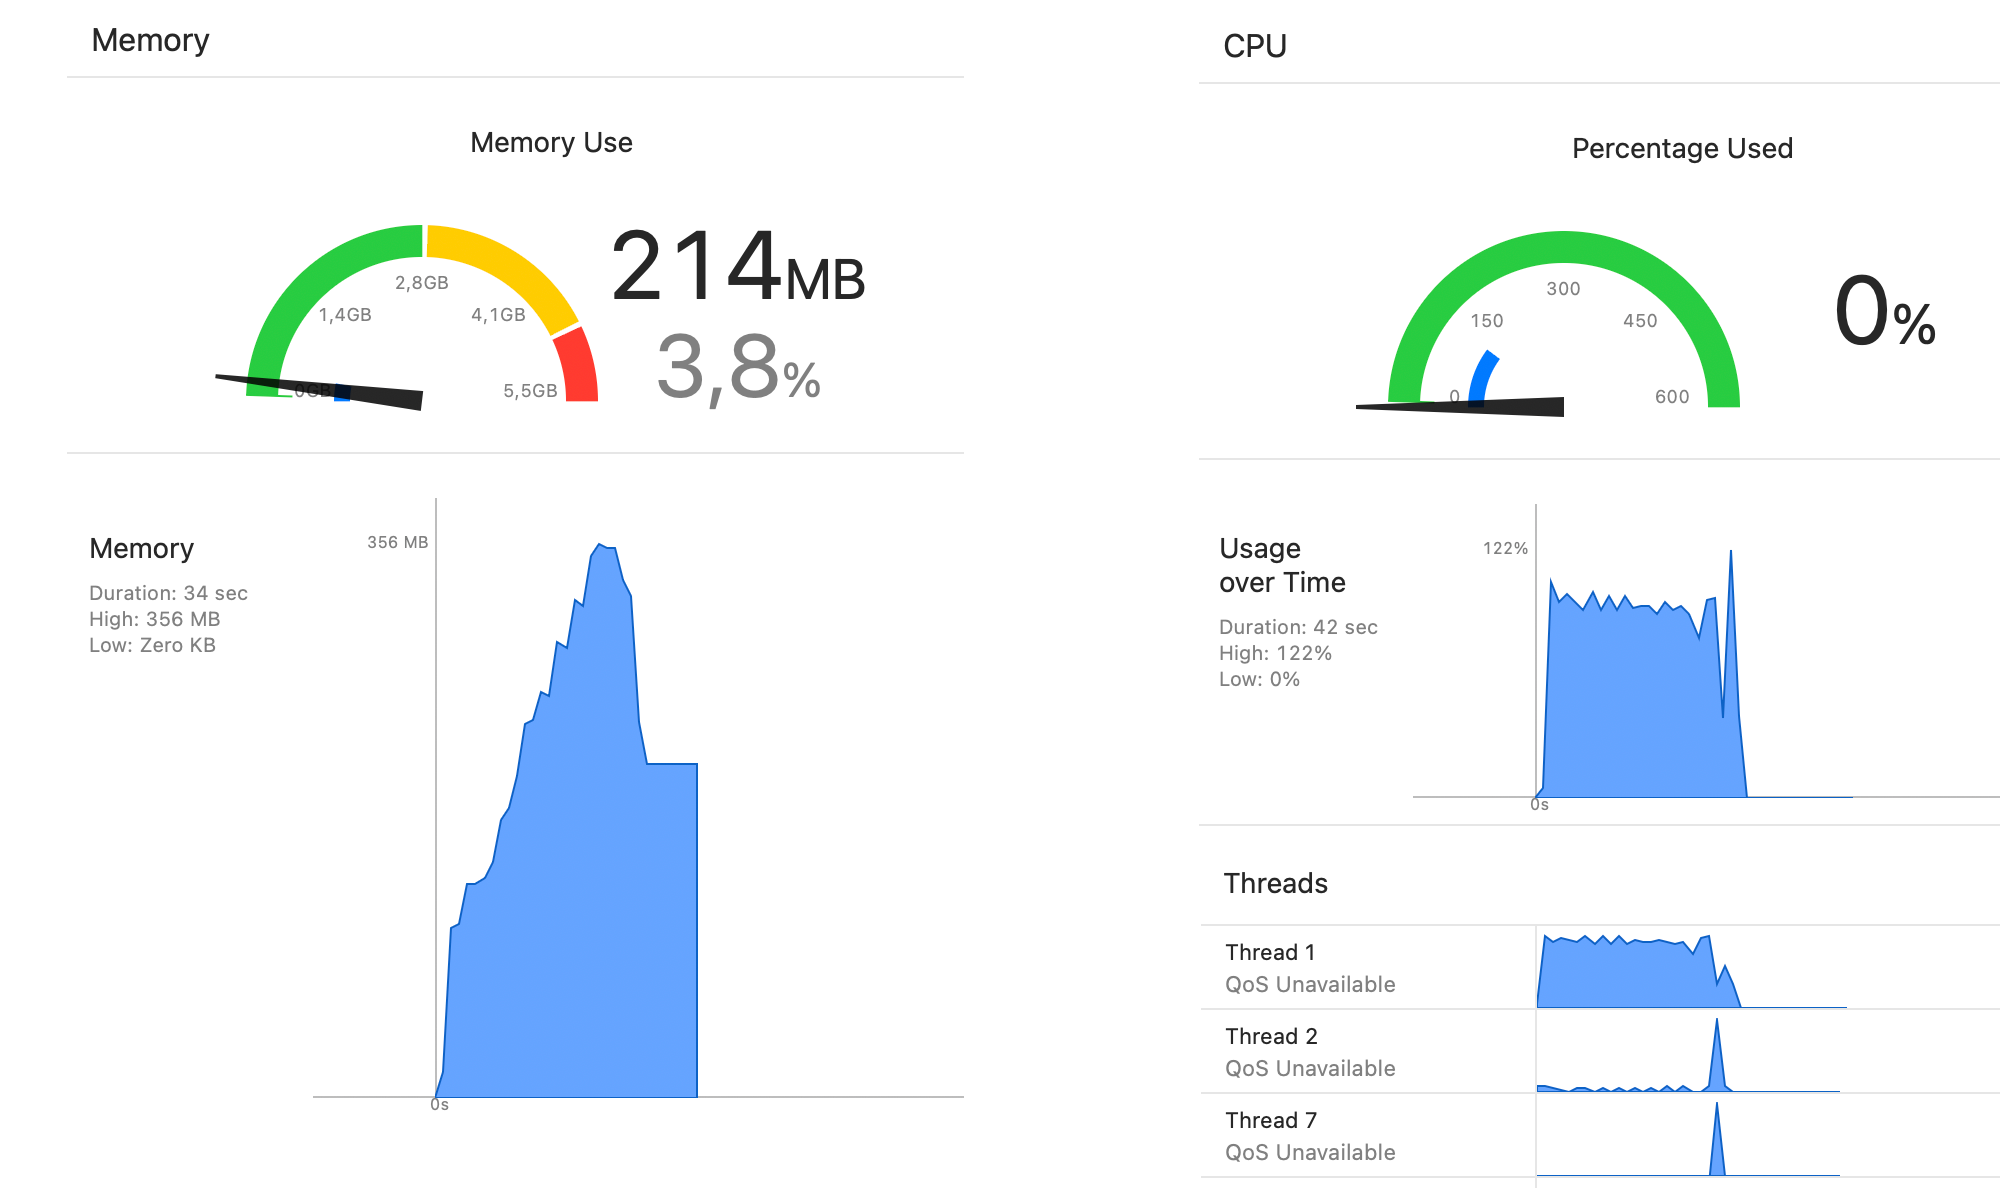
This yields marked improvement in time, dropping from 40s to 17s:
===============
CoreData: 1.000.000 Simple Objects
===============
Total 1000000 User instantiation + Create: 17.0897
190 users named `Jane`
Fetch users named `Jane` in age order: 0.1683
190 users named `Jane` being renamed to `Wendy`
190 users renamed to `Wendy`
Rename users named `Jane` to `Wendy`: 0.0617
DB file size: 72.70 MB
Delete all users: 2.7786
It’s more important what happens with memory usage, which peaks around 350 MB, a sharp drop from 1050 MB:
Even though this is impressive improvement, that import code is not really optimal Core Data; not even proper for Core Data.
- There’s literally no sense to create
ManagedObjectoutsideManagedObjectContextif you eventually want to save that object. - Further — Core Data’s primary good practice is to perform all operations related to it inside its own queue meaning we should do everything import-related inside
performorperformAndWaitmethods.
let importer2: (Int) -> Void = { limit in
	let context = db.context
	context.performAndWait {
		logExecutionTime("User instantiation") {
			(0..<limit).forEach { _ in
				let _ = CoreUser(moc: context)
			}
		}

		logExecutionTime("Save users") {
			try! context.save()
		}
	}

	context.reset()
}
That is recommended way to do any Core Data piece of work. CPU and memory graphs reflect that:
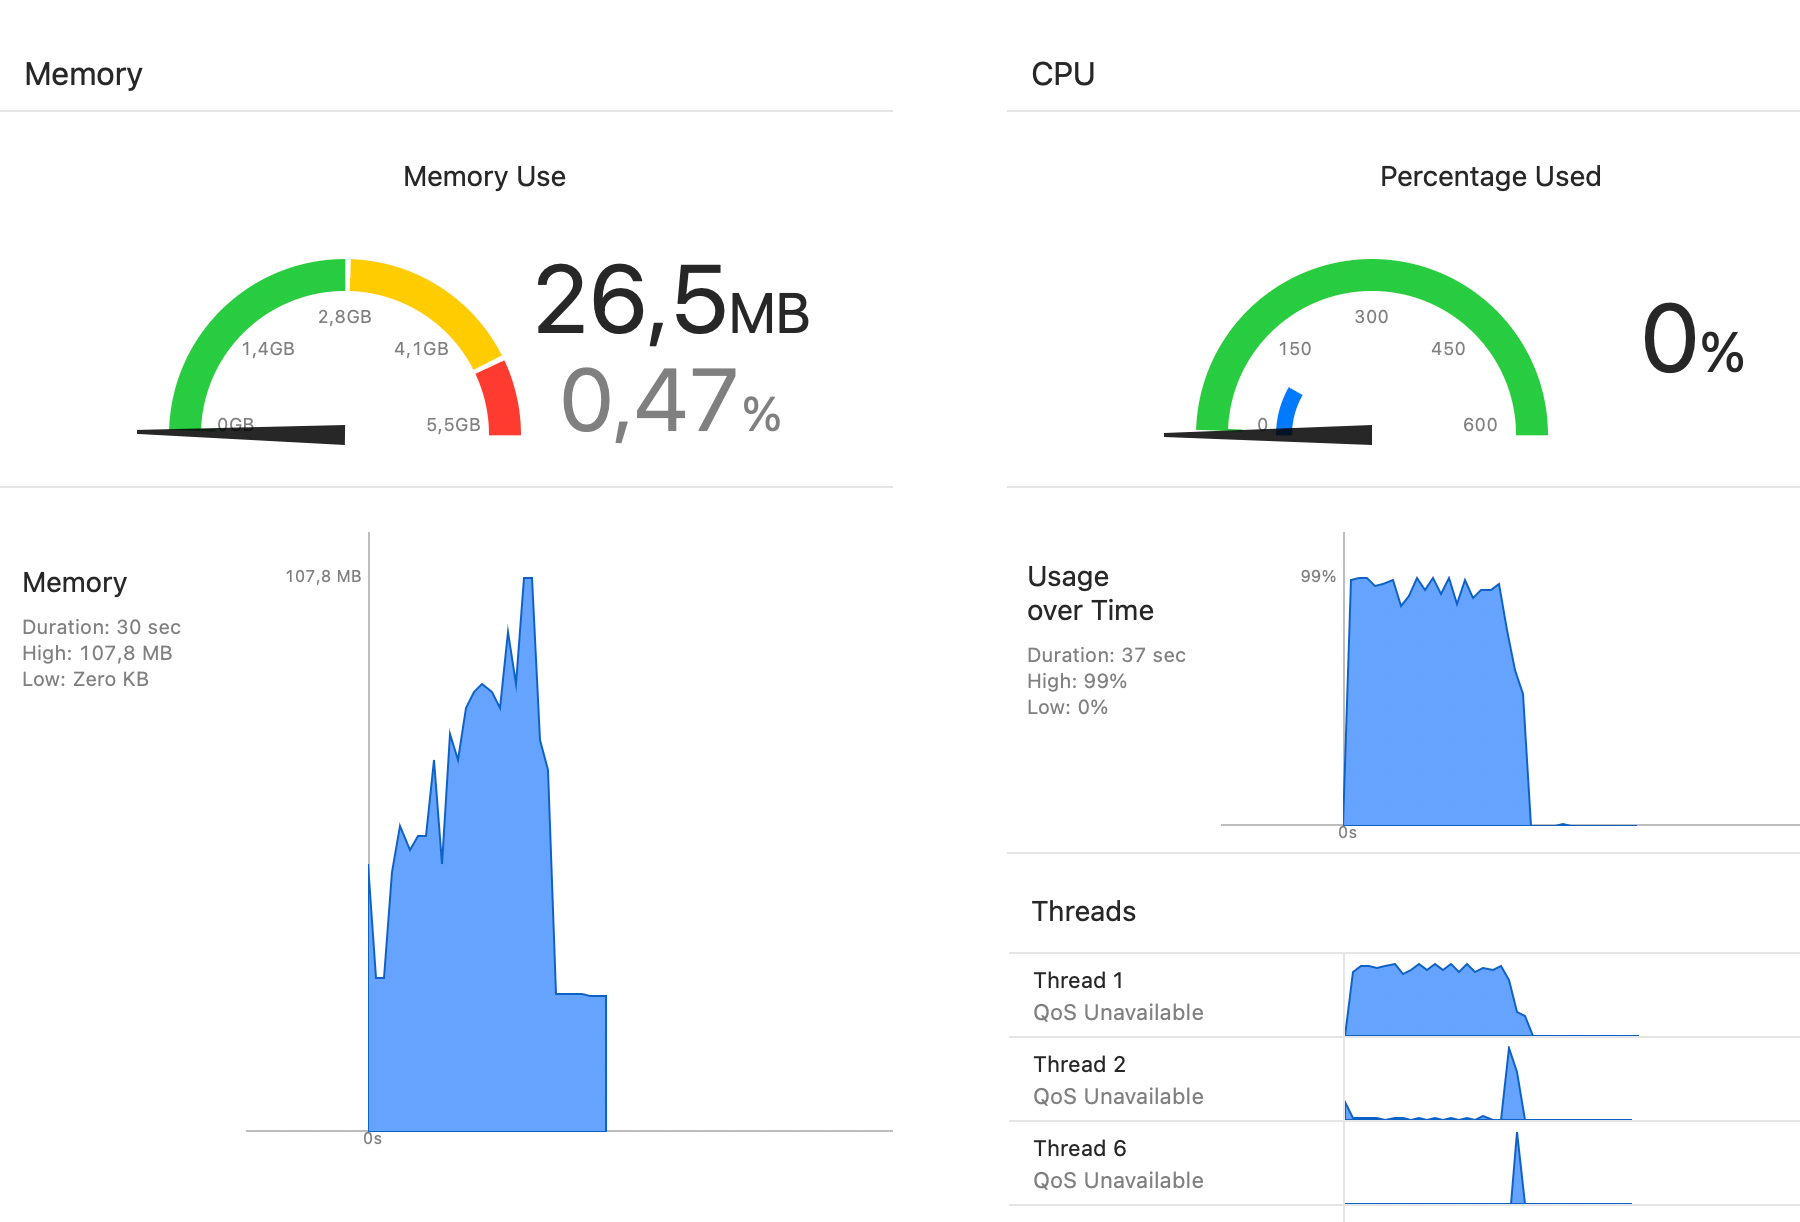
even though raw numbers are very similar to previous approach:
===============
CoreData: 1.000.000 Simple Objects
===============
Total 1000000 User instantiation + Create: 16.1105

232 users named `Jane`
Fetch users named `Jane` in age order: 0.0678
232 users named `Jane` being renamed to `Wendy`
232 users renamed to `Wendy`
Rename users named `Jane` to `Wendy`: 0.0610

DB file size: 72.46 MB

Delete all users: 2.7570
Thus by using somewhat reasonable but still sizable chunks (100k records) of the original data set and employing Core Data best practices, we lowered peak memory usage 10× and shortened total time spent about 2.5× which is no small feat.
Updated tests are on GitHub.
This is pure stress test which has its merits; it can help choosing appropriate persistence solution based on what you are trying to solve. Keep in mind that Core Data was never designed for raw performance; it’s a super powerful object graph framework that also does persistence.
In real apps, I advise you to never do things like making import operations with 100k records. Not even 10k records. What would you do with 100k records import if it fails? How can you even reason around conflicts or failure to save with 100k records? There is no UI you can present that will be able to help a person resolving the issue, whatever it is. Even if it’s just pure background import with no user interaction at all — in case of any failure you will need to at least repeat the downloading, processing and saving of your data. It’s much less expensive to repeat 1k record import than 10k or 100k.
Be sensible.
I assume similar improvements could be done for SwiftData but I don’t work with it thus won’t attempt to improve it. I ran its original test which took way more time than Core Data, spending 148s (!) for 100k records import.